






Verified Energy Intelligence

You Know Your Total Bill. You Don't Know Which Floor Is Driving It.

Orijtech Energy installs sub-metering at every cost-generating point in your facility — giving your CFO, COO, and operations team verified, real-time data on where every shilling goes.

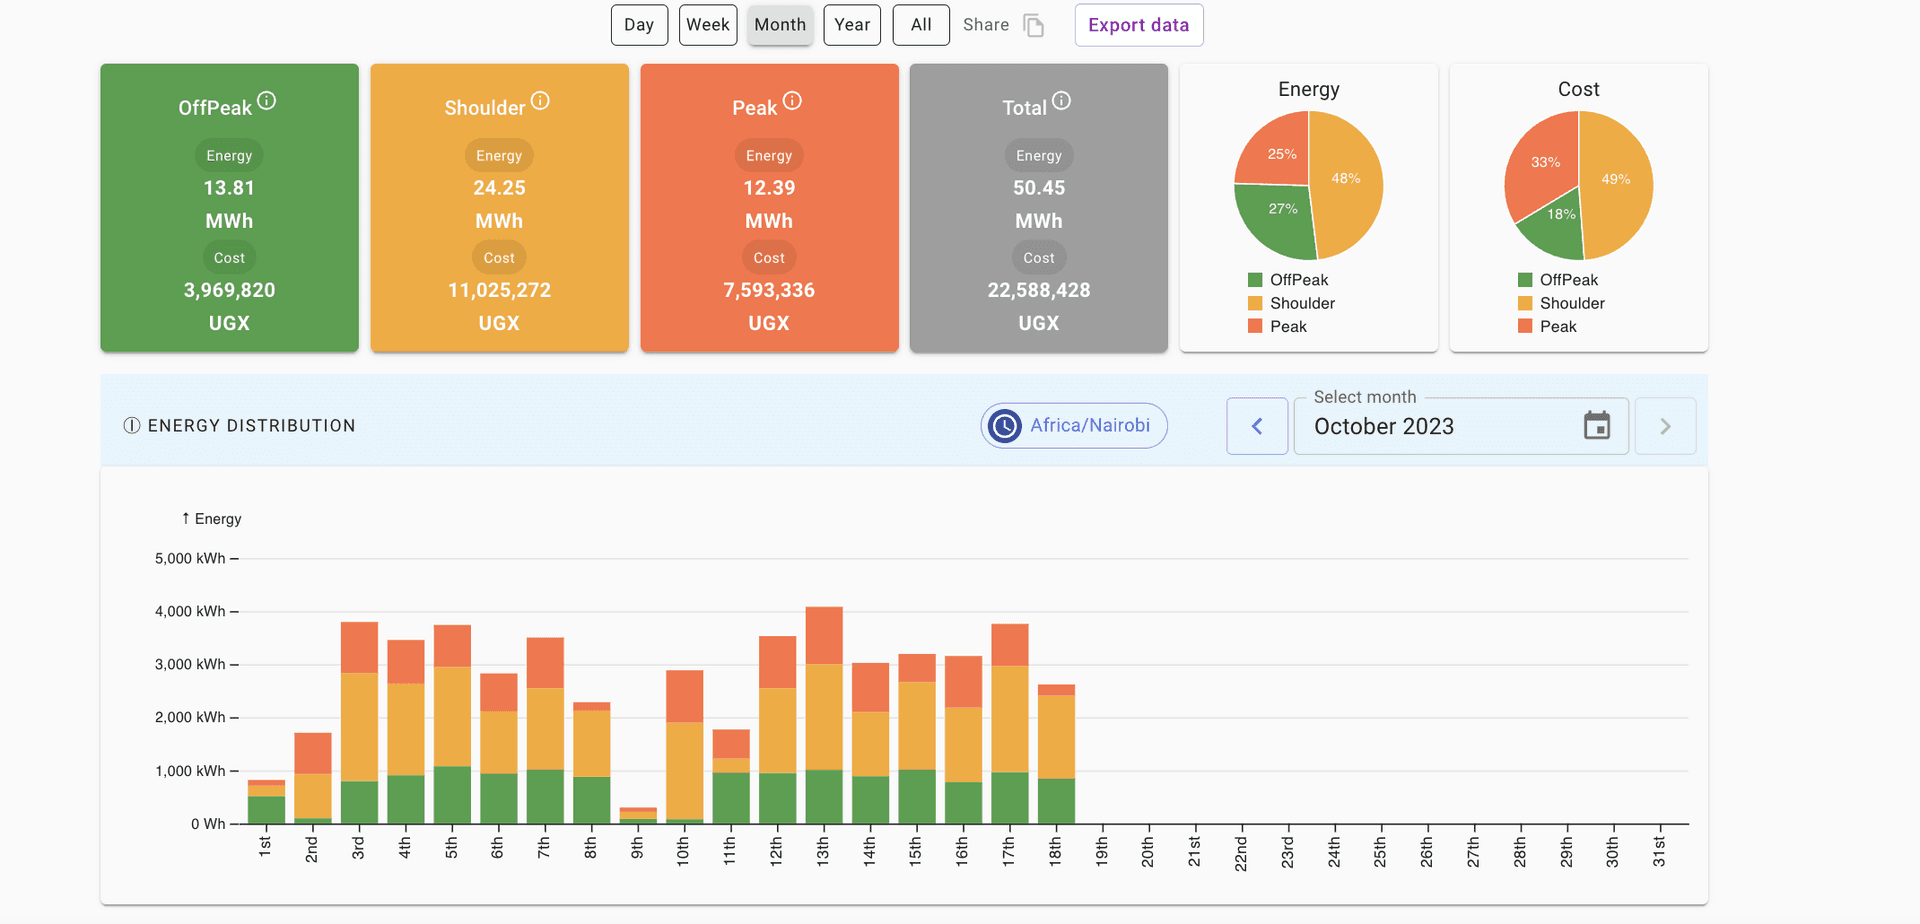
Energy Intelligence Dashboard
kWh Today847.3+12% vs avg
Peak Demand142 kWLaundry floor
Cost This MonthUGX 4.2MOn track
Consumption — Last 24 hrs
ZoneLive kWStatus
Laundry Floor48.2Active
Admin Block19.7Active
Chiller Plant61.4High load
Generator Set12.9Active

Trusted by Uganda's leading commercial and industrial organisations

Sheraton Kampala
Kampala Serena Hotel
KCCA
QCIL
JESA
Riley Packaging
Nice House Plastics
Crane Paper Bags
Steel and Tube
Uganda Batteries
KMC
Oxylife
Sheraton Kampala
Kampala Serena Hotel
KCCA
QCIL
JESA
Riley Packaging
Nice House Plastics
Crane Paper Bags
Steel and Tube
Uganda Batteries
KMC
Oxylife
UGX476M+

Saved or avoided for clients

40+

Sites monitored across Uganda

6

Sectors served

12–25%

Average energy cost reduction

From Your Facility to a Decision in Four Steps

Orijtech installs, monitors, and reports — so your team gets actionable intelligence without adding operational burden.

Step 01

Your Facility

Sub-meters installed at every transformer, distribution board, and key load point.

Step 02

Smart Meter Network

Meters capture consumption across all monitored points, refreshed roughly every five seconds.

Step 03

Orijtech Platform

Data transmitted to our cloud platform where it is validated, structured, and analysed.

Step 04

Decisions You Can Act On

Live dashboards, monthly reports, and alerts your team acts on: verified intelligence, not estimates.

What We Do

Not Five Services. One System.

Orijtech runs one intelligence loop — instrument the facility, measure everything, analyse it, and turn it into decisions. Everything below is a facet of that one system, not a separate product.

01

Instrument

Sub-meters at every transformer, board, and key load point.

02

Measure

Real-time consumption captured across every monitored point.

03

Analyse

Data validated, structured, and turned into cost attribution.

04

Advise

Reports, alerts, and recommendations your team can act on.

Smart Energy Monitoring

Meters at the points that matter, feeding a live platform where management sees exactly where electricity goes and what it costs. This is the system — everything else is what it makes possible.

Explore the system

Not sure where to start?

A site assessment maps your facility's energy profile in under five days — and shows you exactly which parts of the system will pay for themselves first.

Request a Site Assessment

Verified Outcomes Across Uganda's C&I Sector

Every result below is based on sub-meter data, not estimates or projections.

Food & Agricultural ProcessingUGX 300M

Solar investment saving

JESA

JESA was about to buy a solar system sized on estimates. Measured consumption proved it was oversized — cutting UGX 300 million from the investment — and revealed a further UGX 40 million a year lost to processing at the wrong hours. Both answers came from the same meters.

Read case study →
Pharmaceutical ManufacturingUGX 100M

Capital expenditure avoided

Quality Chemical Industries Ltd (QCIL)

One monitoring deployment settled two questions QCIL had been weighing on assumption alone — proving the existing transformer was not overloaded, and exposing more than a year of utility overbilling. Two decisions, one evidence base.

Read case study →
HospitalityUGX 36M/yr

Annual saving

Sheraton Kampala Hotel

Sheraton Kampala knew its power bill was high, but not what drove it. Energy monitoring traced a major share of the cost to one habit — running the industrial laundry during peak-tariff hours. Rescheduling it, at no capital cost, saves UGX 36 million a year.

Read case study →
Government & Public InfrastructureFire risk

Safety incidents prevented

Kampala Capital City Authority (KCCA)

At USAFI Market, the risks stayed invisible until they were measured. Energy monitoring surfaced voltage instabilities and phase imbalances serious enough to pose a fire hazard — and, separately, illegal connections draining the public supply.

Read case study →

Estimate Your Energy Savings Potential

Based on sub-metering data across 40+ Ugandan facilities. Actual savings vary by facility type and energy profile.

Estimated Annual Savings

UGX24M

per year across selected sites

Typical Payback Period

6 months

from installation to full cost recovery

CO₂ Equivalent Reduction

17 tonnes/year

estimated carbon footprint reduction

Illustrative estimates. Your actual figures come from a site assessment.

Get verified assessment →

What Clients Say

Decisions Made on Data, Not Estimates

We had a transformer upgrade on the capital budget. The sub-meter data showed it was unnecessary. We avoided a UGX 100M expenditure based entirely on what the meters revealed.

QCIL
Operations Director
Operations Director, QCIL

The load-shifting analysis identified UGX 36M in annual savings from a scheduling change alone — no capital investment, no disruption. The data made the decision obvious.

Sheraton Kampala
Engineering Manager
Engineering Manager, Sheraton Kampala
40+
Sites monitored
UGX 476M+
Saved for clients
5+ years
Operating in Uganda

Ready to See Your Facility's Energy Profile?

A site assessment delivers a complete energy intelligence picture in under five days. No commitment required.